 Math and Stats
Home / Tools
Tool directory
Choose a question to investigate, or find an assigned activity by title.
Featured investigations
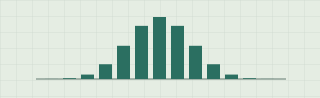
Sampling distributions
Draw samples from a known population. Change the sample size and compare the spread of the means.
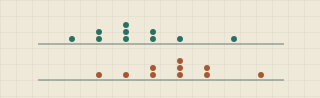
Compare distributions
Plot one or two data sets on the same scale. Compare their centers, spreads, and unusual values.
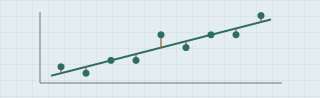
Regression and influence
Fit a line to paired data. Find out how one observation changes the slope and residuals.
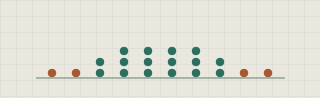
Shuffle the groups
Shuffle treatment labels and compare the observed difference in means with chance differences.
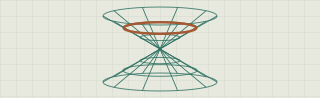
Slice a cone
Tilt a plane through a double cone. Compare the three-dimensional cut with the curve in the plane.
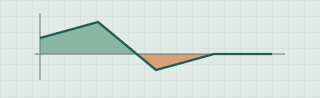
Accumulation from a rate
Trace a cart’s motion. Use signed area under its velocity graph to predict its position.
All tools by subject
Statistics by taskStatistics
- Compare distributions
Compare the shapes, centers, and spreads of one or two groups of measurements.
- Categories and two-way tables
Compare counts and conditional percentages. Test for association in a two-way table.
- Scatterplots and regression
Fit a line to your data. Compare the fit with and without one observation, then use residuals to explain the difference.
- Distribution calculator
Find areas and percentiles for normal, t, and chi-square models, or probabilities for binomial counts.
- Discrete random variables
Build a probability distribution and find its expected value and standard deviation.
- Chance in the long run
Watch a running proportion across repeated independent trials and compare it with the model.
- Sampling distributions of means
Explore how sample size and repetitions affect the distribution of sample means.
- Confidence intervals and tests
Estimate or test one or two proportions, one or two means, or a paired mean difference.
- Kurtosis and rare values
Compare the chance of crossing a cutoff with the fourth-power contribution of distant observations.
- AP Statistics Flashcards
What can you explain before you turn the card?
- Bootstrap from One Sample
How much could a statistic vary if this one sample stood in for the population?
- Decision Rule Simulator
How many late trips should trigger a review?
- Dotplot Workbench
Which summaries move when you change just one observation?
- Guess the Regression Line
Can you fit the paper-bridge data by eye?
- Probability in a Two-Way Table
Does switching the order of a conditional probability change the answer?
- Sampling Methods on a Map
Can a sample give a precise estimate of the wrong neighborhood?
- Sampling proportions
What changes when you quadruple the sample size?
- Shuffle the Groups
Could a seven-centimeter advantage come from the assignment alone?
Algebra and precalculus
- Build a Rational Function
When does a shared factor leave a hole, and when does it leave a vertical asymptote?
- Slice a Cone
When does an ellipse become a parabola?
- Transform a Point, Then the Function
If (2, 3) is on the original graph, where does it land on g(x) = f(2x − 4) + 1?
Calculus
- Accumulation from a Rate Graph
Where will the cart end up after eight seconds?
- Average Rate to Instantaneous Rate
What happens to a secant slope as its two points come together?
- Riemann Sum Challenge
When does a rectangle or trapezoid give too much signed area?
Classroom tools
- Build a Counterexample
Can two datasets share a mean and a median but have different spreads?
- Graph Reveal
What can you infer from a graph before you know what was measured?